“A MODERN EXPERIENCED BASED PRACTICE OF ANAESTHESIOLOGY”
You have asked for it – a completely new type of meeting – fewer lectures, more interaction. This year we are premiering the “Metasession” where common questions and controversies will be addressed by an expert panel “In Conversation.” Plus the usual workshops, posters, case presentations and, of course, it wouldn’t be WAS without the controversies: “So you think you know about….”
Registration: EVENTBRITE
Hosted by Western Anaesthesiology Society, University of Galway, In Conjunction With Portiuncula and Roscommon Hospitals and Approved for CME by the College of Anaesthesiologists of Ireland
Click Below to Download Abstract Submission Form (Scientific Presentations, Research, Audit and Case Presentations)
PROGRAMME
Friday April 17th 2026
Morning Workshops 09.00-13.00 (require additional registration)
Regional Anaesthesia Masterclass (Consultants Only)
Facilitators: John McDonnell & Niall Cribben (plus faculty)
Airway Workshop
Facilitators: Ciara Hanley & Brian Harte (plus faculty)
1.00 “Poster” Presentations – Trainees
Facilitator: Colm Keane
Research and audit studies are presented by a variety of trainees and students.
2.30 – 4.00 Regional Anaesthesia Metasession
The team will discuss current hot topics in regional anaesthesia, how they approach common and uncommon nerve blocks. There will be discussions about chest wall and abdominal blocks; additives and whether or not they are valuable; ideal block duration; compartment syndromes; anticoagulants and blocks; LAST – is it the dose, the volume or the location that is the main problem
Facilitator: John McDonnell
METASESSION TEAM
Vicentes Roques (Murcia, Spain)
Roman Zuecher (Basel, Switzerland)
John McDonnell (GUH)
Niall Cribben (RUH, GUH)
4.00 – 4.30
Coffee
4.30 – 6.00 Airway Management Metasession
Facilitator: Craig Lyons
METASESSION TEAM
The team will discuss airway strategy, videolaryndoscopy performance, how and when to do awake intubation, VAFI, airway surgery, the use of HFO amongst other things
Craig Lyons (GUH)
Alaistair McNarry (Edinburgy, Scotland)
Tony Hennessy (Cork)
6.15 NAP 8 Quick Overview Aoife Driscoll (Cork)
6.30 – 7.15 Plenary Lecture and Interview
Dr. Alistair McNarry – President of the Difficult Airway Society
Facilitator: Dr Michael Callaghan, UHG
7.30 Barbecue
Saturday April 18th 2026
08.00 Case Presentation Competition
Facilitators: Mike Scully & Martina Melvin
These are clinical cases that are presented by anaesthesia trainees that illustrates clinical conundrums in anaesthesiology and critical care.
09.15 – 10.45 University of Galway Session
Moderators: Prof. John Laffey & Prof. John McDonnell
Prof. Vincenzo Russotto, University of Turin
“The Physiologically Difficult Airway”
Vicentes Roques (Murcia, Spain) – “AI is coming to Regional Anaesthesia”
10.45 – 11.15 Coffee
11.15- 12.30 SYT Session “So You Think You Know About…….”
This Hi-Impact session will contain 4 talks about issues relating to anaesthesia and critical care that most of us THINK we understand, but once you peel away the layers we….probably don’t.
Michael O’Connor (Univ. Chicago) “….Large Language Models” ✅
Lua Rahmani (Toronto)– “TCI Propofol….do we have any idea what we are targeting?”
Mai O’Sullivan (GUH) – “You think that Simulation Training is a waste of resources?
Leo Kevin (GUH) – “Adjuncts to Pain Management in the Operating Room – are we deceiving ourselves?”
Pat Neligan (GUH) “Preoxygenation – are you doing it all wrong?”
12.30 – 13.15 Plenary Lecture
Michael O’Connor (University of Chicago) – “Understanding Medical Accidents: What Have We Learned and Failed to Learn Over 20 Years?”
Lunch in the Main Restaurant
Coffee in Exhibit Hall
14.30 – 16.00 Intravenous Anaesthesia Metasession
Facilitator: Dr Lua Rahmani (Toronto)
The team will discuss a range of topics that are current or controversial in Intravenous Anaesthesia. The current role of propofol and whether we are overdosing our patients; propofol vs remimazolam; the use or underuse of ketamine; do we need BIS or equivalent during TIVA? Is there any benefit to “modern” TCI models (Schnider/Eleveld) – and what is the story in elderly, obese and ICU patients? Is TIVA “green”? TIVA in paediatrics, radiology, and ICU; the role of dexmedetomidine, lidocaine, magnesium and all of those other “adjuncts” etc. Is “opioid free anaesthesia” a meaningful advance or just cheap hype?
The METASESSION TEAM:
Lua Rahmani (Toronto)
Eoin Young (Cambridge)
Jacinta McGinley (Crumlin)
20.00 Gala Dinner in the Restaurant
Join us to celebrate another great year in our specialty and in our region. Hosted by Dr Mark Ross, President of WAS. Special Guest Prof. Donal Buggy, President of the College of Anaesthesiologists of Ireland.
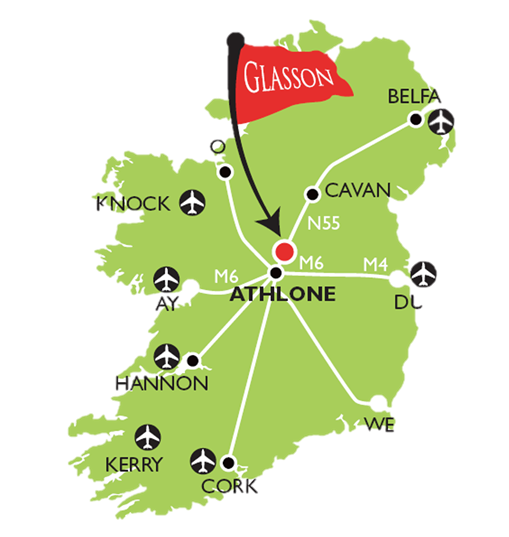
THERE ARE LOTS OF HOTELS AND GUEST HOUSES IN THE AREA – GLASSON IS NEAR ATHLONE AND THE M6 MOTORWAY – AN EASY COMMUNTE FROM ANYWHERE EAST, WEST, MIDLANDS.
Social and Other Activities
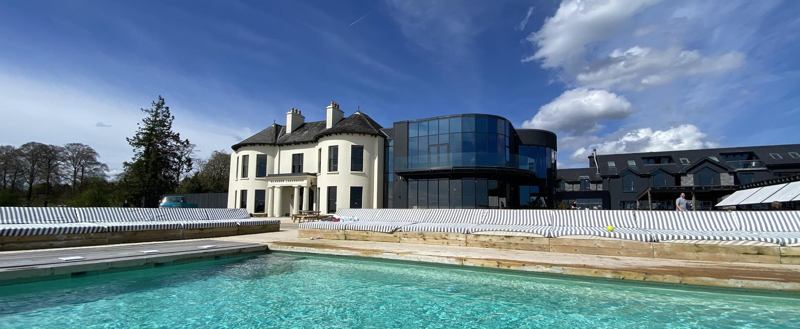
Outdoor heated swimming pool on site
Gym on each floor
Hot tubs
18 Hole Golf Course
Driving Range
Paddle Boarding
Kayaking
Row Boats (including motorised ones)
| WESTERN ANAESTHESIA SOCIETY |


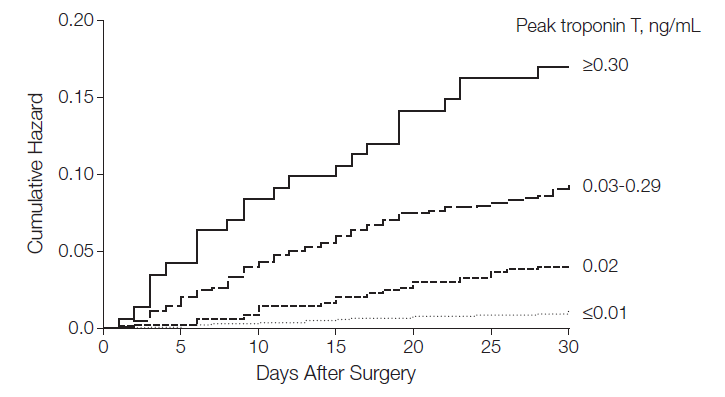
 The SOLAR trial, which compared a composite outcomes in perioperative colorectal or orthopaedic patients, assigned to Lactated Ringers’ (similar to Hartmann’s) solution – over 2 week blocks over a few years (8,616), has been published this month in